The Numbers Every App Builder Needs to Know in 2026
This post is directly from a webinar I hosted with FlutterFlow. You can watch the entire webinar here: The Numbers Every App Builder Should Know in 2026.
Note: I used AI to convert the webinar into this post.
If you spend ten minutes scrolling Twitter, Reddit, or indie-hacker forums, you’d be forgiven for believing that launching a $10k MRR subscription app is just a weekend build and a Stripe account away.
The reality of the app stores tells a very different story:
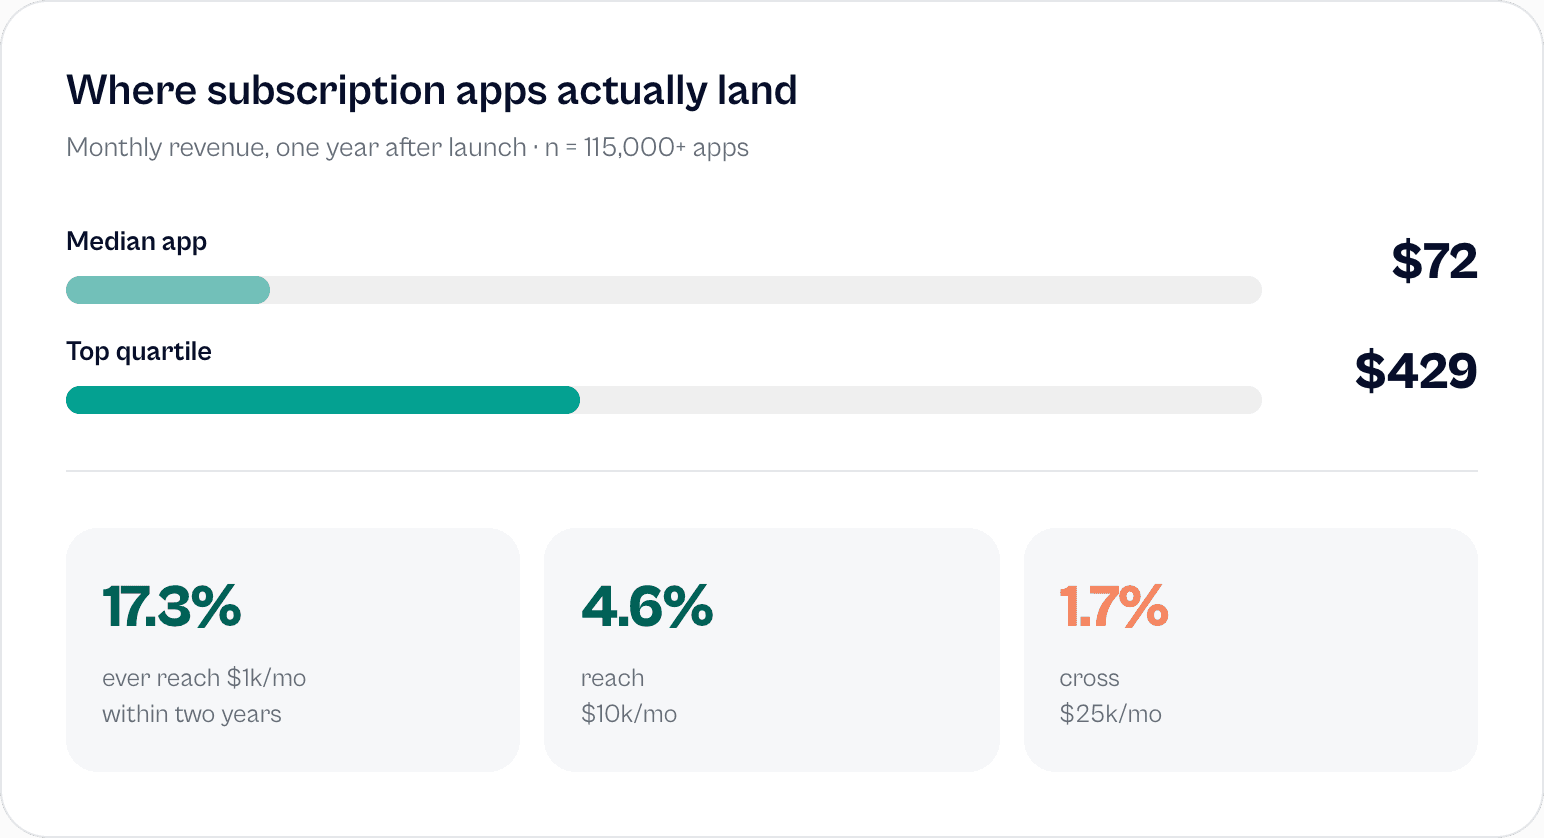
- The median subscription app makes just $72 a month one year after launch.
- The top quartile (top 25%) reaches $429/month.
- Only 17.3% of apps ever reach $1,000/month within two years.
- Only 4.6% reach $10,000/month.
- A tiny 1.7% cross $25,000/month.
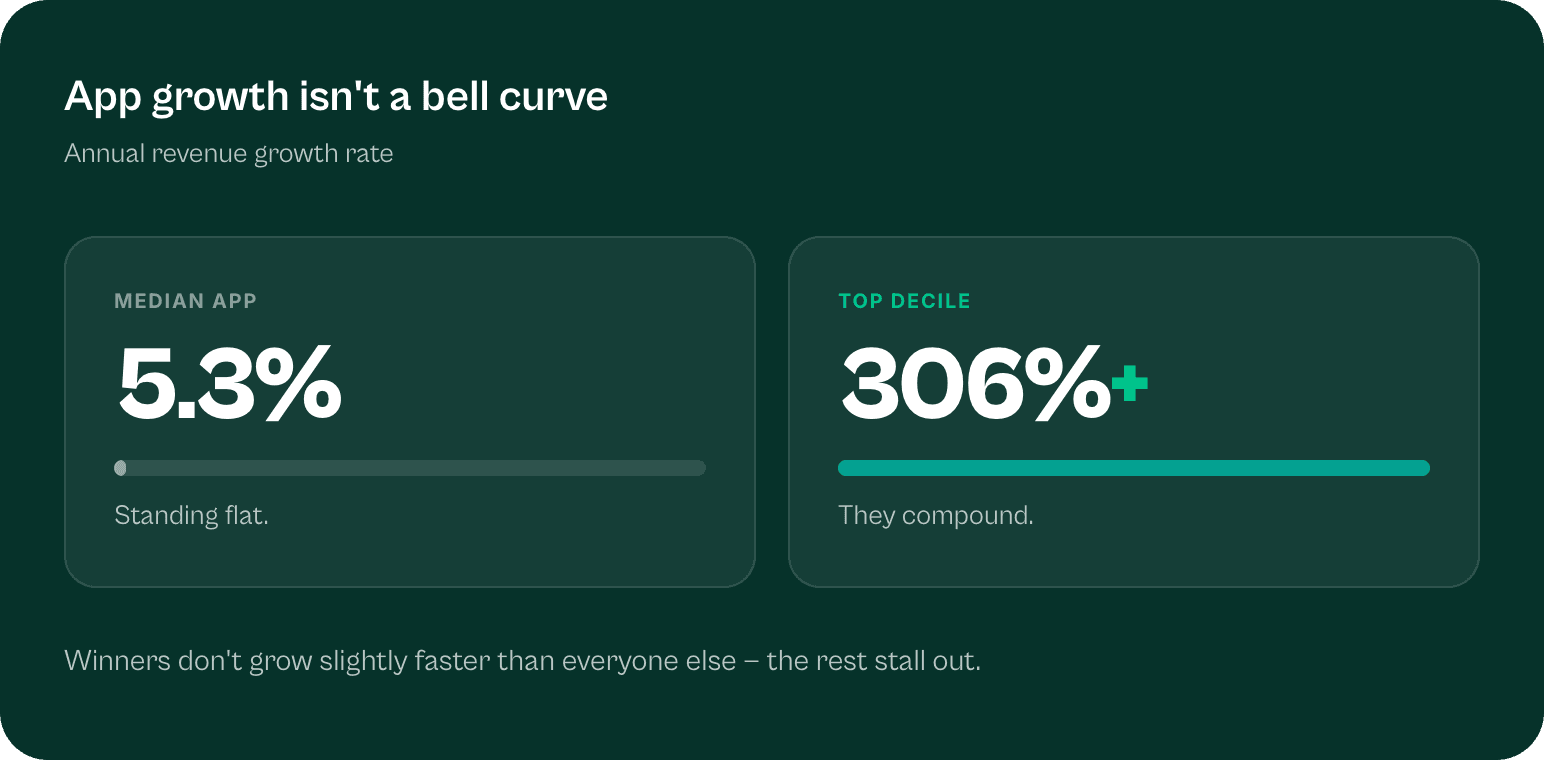
Furthermore, app growth does not follow a bell curve; it is a barbell. The median app grows at just 5.3% annually—essentially standing completely flat. Meanwhile, the top 10% grow at 306%+ annually. Winners don’t grow slightly faster than everyone else; they compound while the rest stall out.
When founders find themselves stuck under that $72/month line, their default reaction is almost always: “I need to build more features.”
They spend weeks writing backend logic, refining user dashboards, or tweaking gamification mechanics. But with zero users, feature debates are the wrong questions. The funnel is your product question.
I recently hosted a workshop in partnership with FlutterFlow diving deep into subscription benchmarks analyzed from over 115,000 apps, $16 billion in tracked revenue, and 1 billion transactions (sourced from RevenueCat’s State of Subscription Apps report).
Here is the breakdown of what the numbers actually say, where users are dropping off, and the exact playbook you need to fix your funnel.
Understanding Quartiles
Before optimizing your numbers, you need to know which benchmark you’re aiming for:
- The Median: Half of all apps sit below this line; half sit above. If your app is below the median on any step, you have a known problem with a known fix.
- Top Quartile (Top 25%): Where serious, working apps begin. If you are launching an app today, this should be your 12-month target.
- Top Decile (Top 10%): What elite performance looks like. This represents your ultimate headroom.
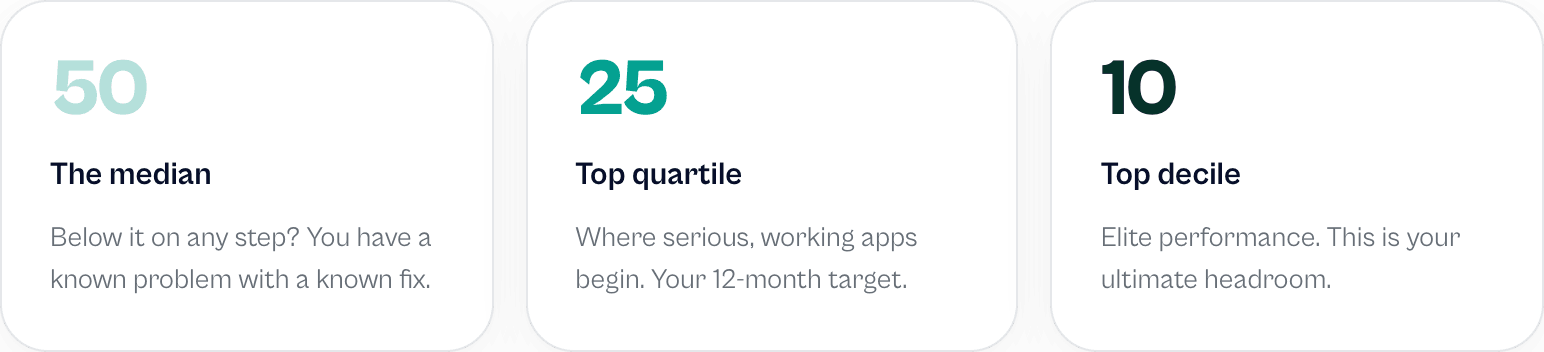
If you are a beginner, your only job is to bring every step of your funnel up to the median first. If you are already an active operator, your targets are the quartile and decile lines.
The 7-Step Funnel
Modern mobile app economics are not driven by the “build it and they will come” philosophy of 2012. Today’s market behaves like an e-commerce performance funnel:
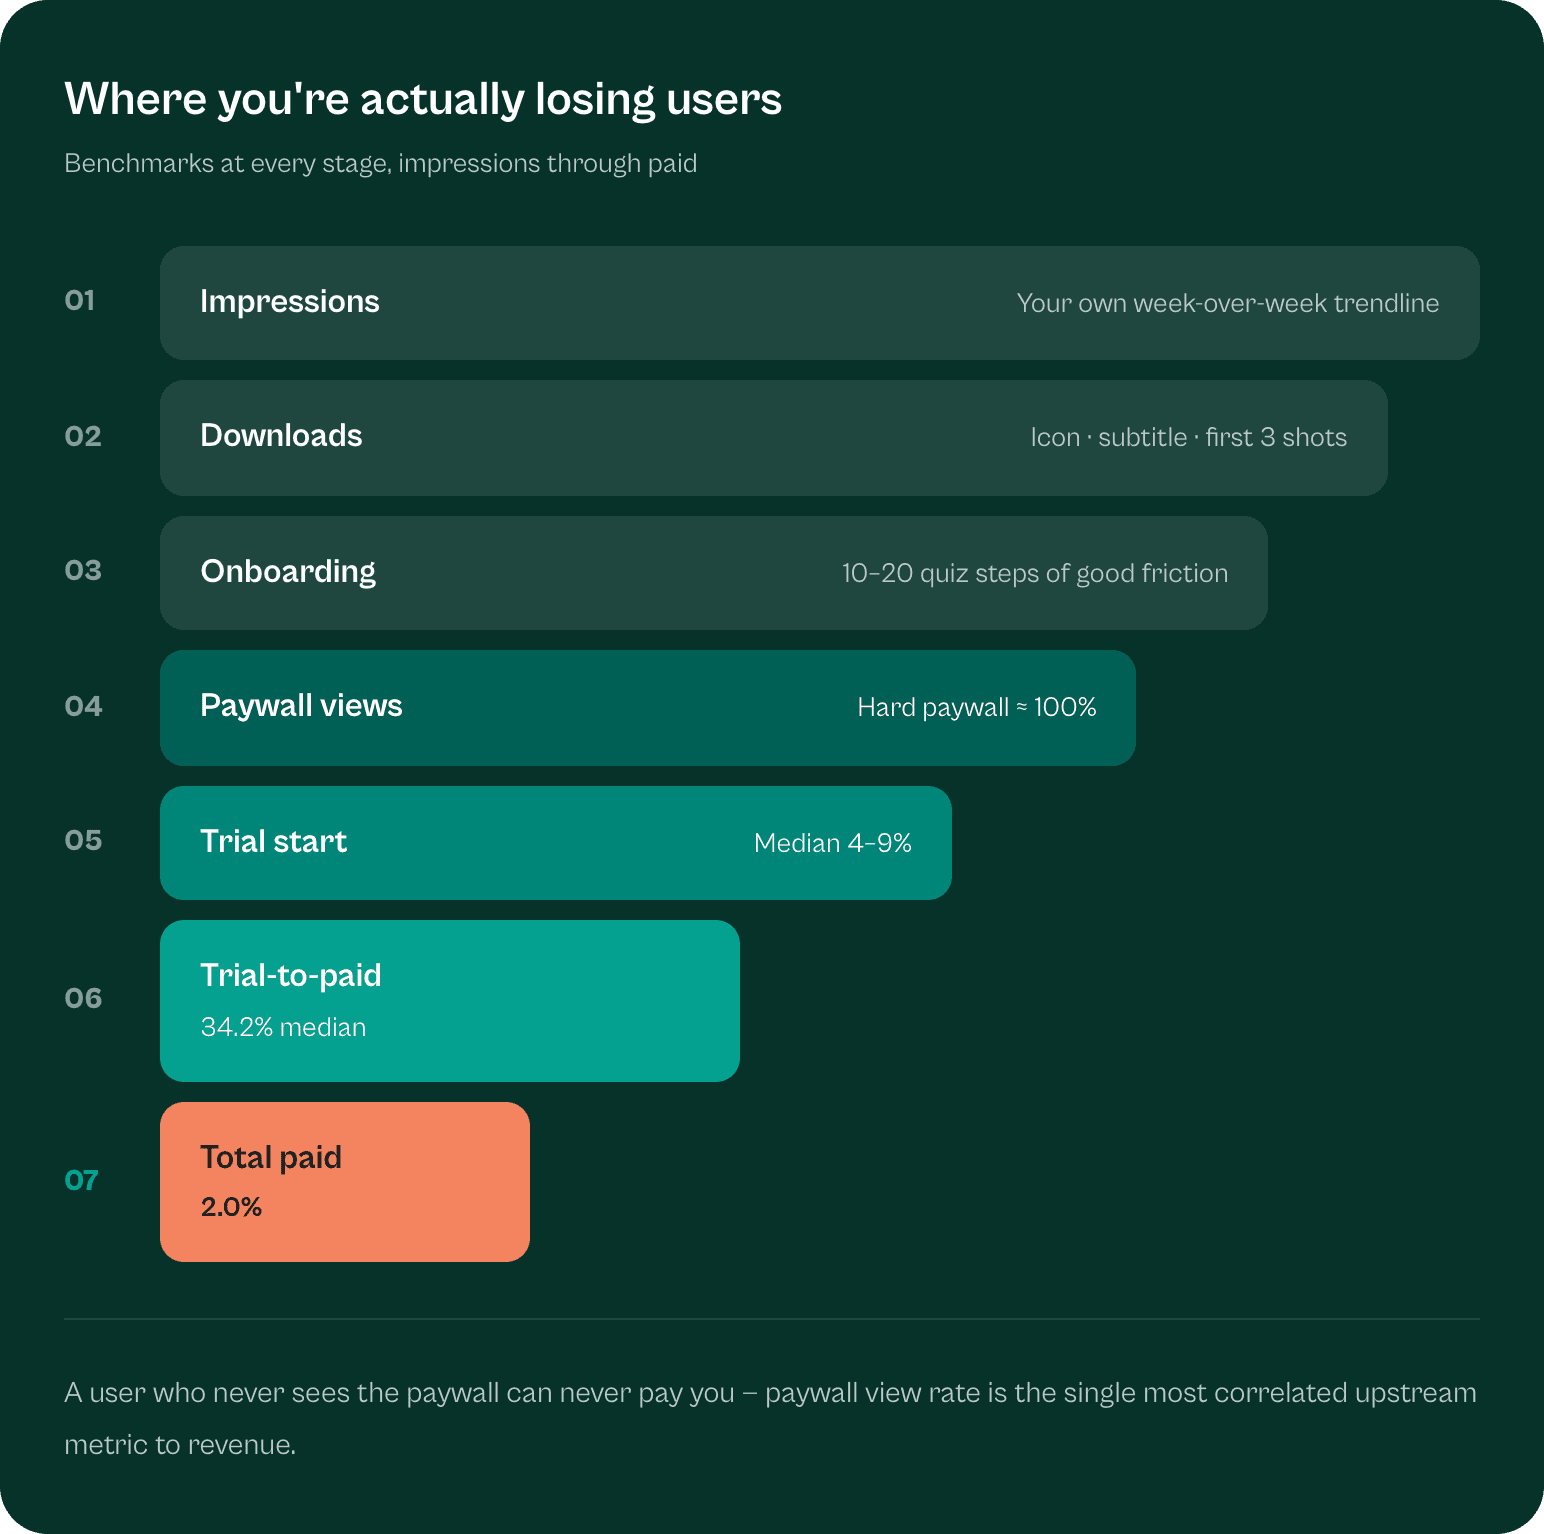
Let’s walk through the benchmarks at each stage.
Step 1: Impressions (Top of the Funnel)
- What it is: The number of unique people who see your app in search results, browse tabs, featuring, or paid ads.
- The Benchmark: There is no published universal median. Your benchmark is your own week-over-week trendline.
- The Reality: If impressions are flat, nothing downstream can save you. Volume comes first. You cannot convert users who don’t know you exist.
- Action Item: Track this weekly via App Store Connect and Google Play Console. Don’t rely solely on keyword stuffing; experiment with Apple Search Ads (ASA) and ASO updates.
Step 2: Download Rate (Listing Conversion)
- What it is: The percentage of users who see your listing and actually install the app.
- The Reality: Your App Store listing is the easiest and highest-leverage place to invest engineering-free effort. It should be treated and iterated on like a direct-response landing page.
- Action Item: Run continuous A/B tests via Apple’s Product Page Optimization (PPO). Test your first three screenshot frames, your app icon, and your subtitle value proposition. Remember: users in the store feed never read your long description. They judge your app based on the title, subtitle, and first 2–3 screenshots.
Step 3: Onboarding Completion (The Middle of The Funnel)
- What it is: The percentage of installs that finish your onboarding flow.
- The Old Advice: “Make onboarding as short and frictionless as possible. Get them straight into the app!”
- The Modern Reality: Short onboarding is dead. High-performing consumer apps (like Noom, which has over 60 onboarding steps) use quiz-style onboarding.
- The Power of “Good Friction”: Asking 10–20 personalized questions engages the user, frames the problem your app solves, builds investment, and establishes value before presenting the price tag. Users who drop off during a well-crafted quiz were never going to pay you anyway—that’s good churn.
- Action Item: Fire a distinct analytics event for every screen. Identify specific drop-off dropouts, eliminate confusing wording, but keep the psychological investment high.
Step 4: Paywall View Rate
- What it is: The share of onboarded users who actually see your paywall.
- The Golden Rule: A user who never sees the paywall can never pay you.
- The Target: If you run a hard paywall, this should be close to 100%.
- Action Item: Paywall view rate is the single most correlated upstream metric to overall revenue. If users have to dig through a settings menu or hunt for a “pro” tab to see your pricing, you are lighting money on fire.
Step 5: Trial Start Rate
- What it is: The share of downloads that start a free trial.
- Category Medians (Download → Trial Start):
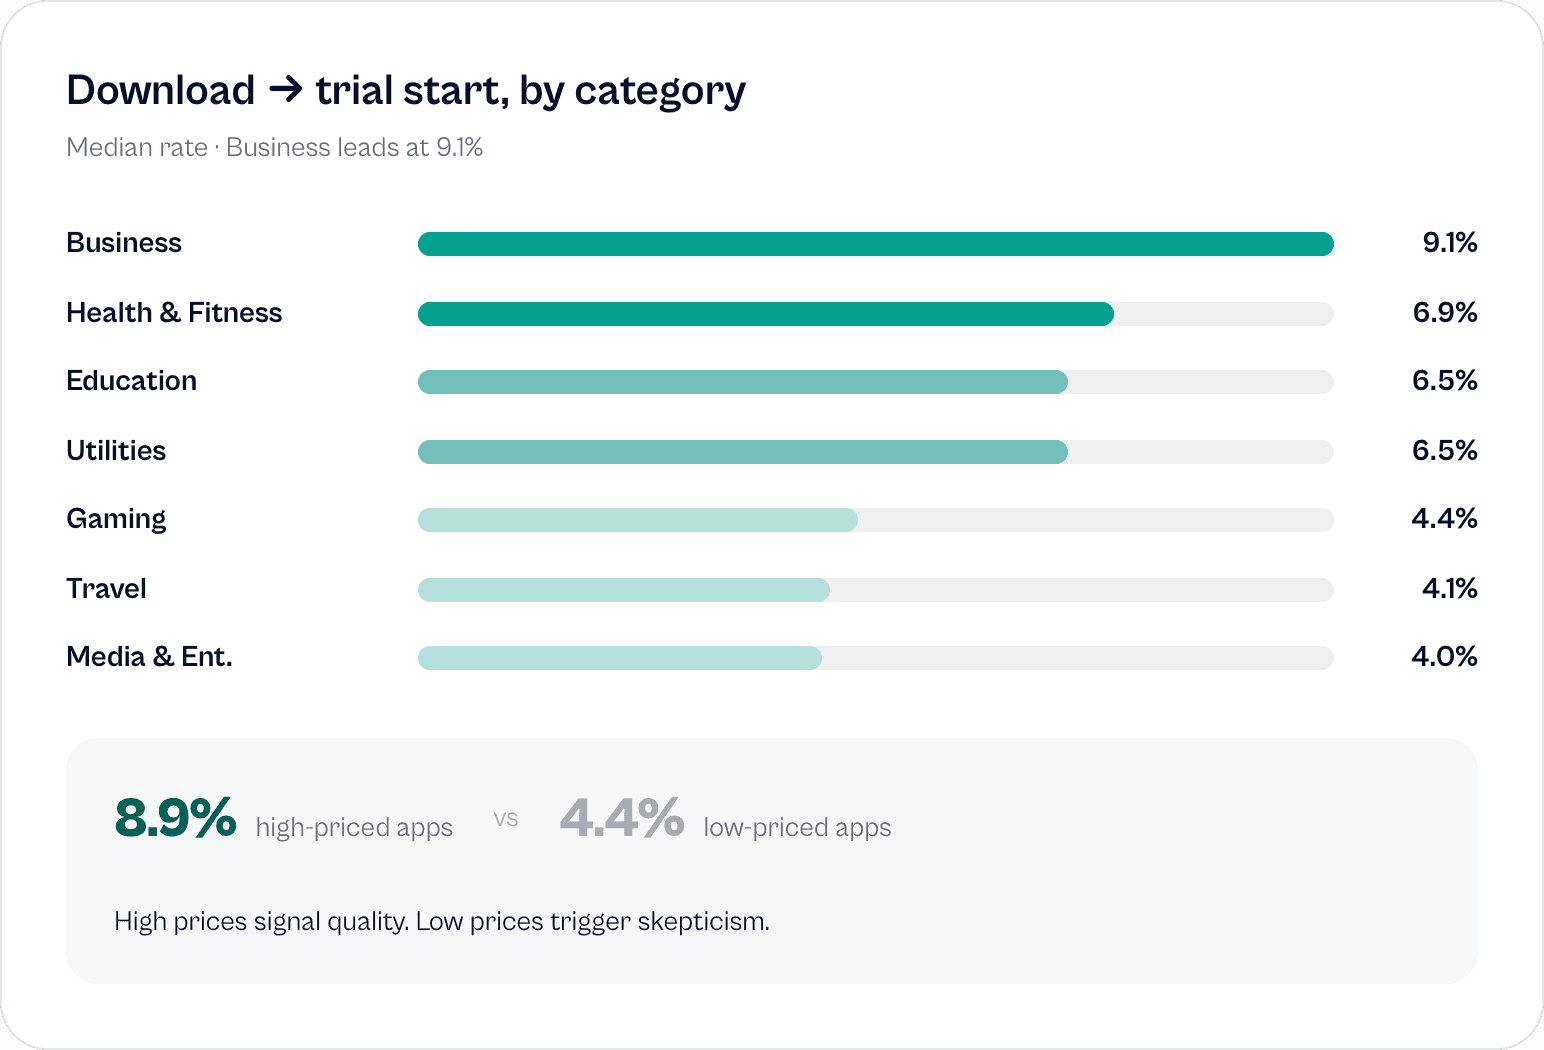
- Key Finding: Higher-priced apps actually start more trials than cheap apps (8.9% median for high-priced apps vs. 4.4% for low-priced apps). Why? High prices trigger a premium quality signal. Low prices trigger skepticism.
Step 6: Trial-to-Paid Conversion
- What it is: The percentage of trial starts that convert into paying subscribers.
- The Benchmark: In North America, the median trial-to-paid conversion rate across all categories is 34.2%. The top quartile hits 47.9%, and the top decile clears 60%.
- The Rule of Thumb: Aim for 1 in 3. If at least a third of your trial users aren’t converting, the problem is your trial experience, not your paywall.
- Trial Length Data:
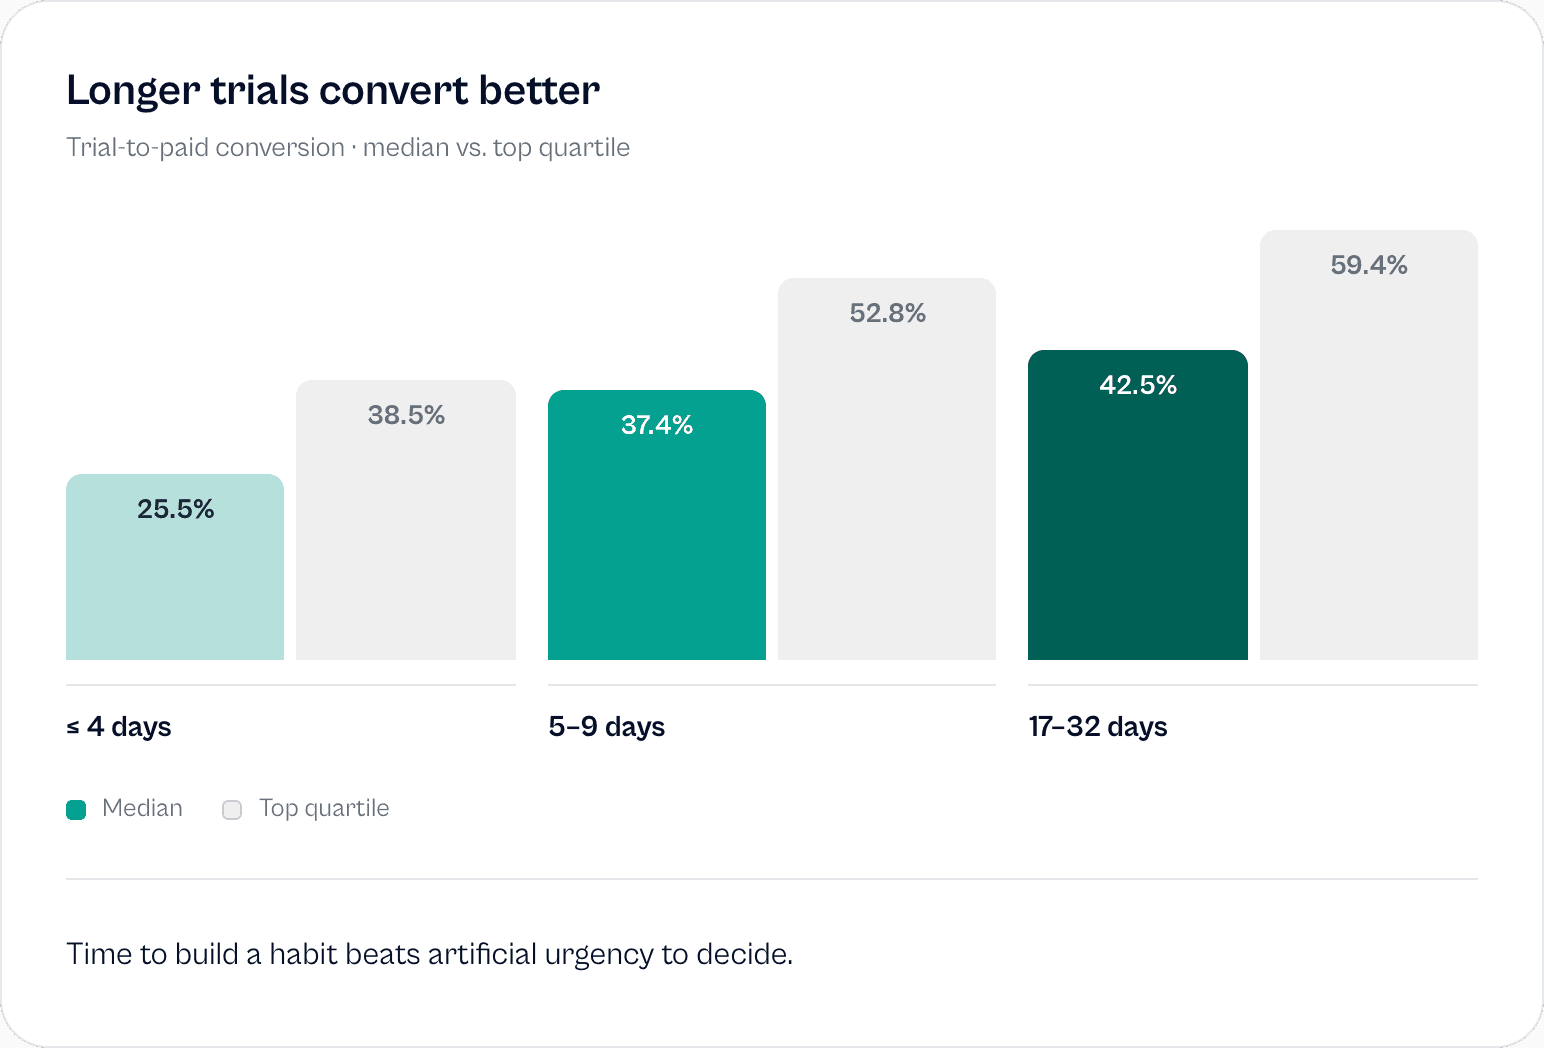
- The Takeaway: Many builders fear long trials because they assume users will get value and leave. The data proves the opposite: time to build a habit beats artificial urgency to decide. While a 90-day trial rarely makes financial sense, a 7-day trial substantially outperforms a 3-day trial.
Step 7: The Composite Benchmark (Downloads → Paid)
- The Universal Benchmark: Across all subscription apps, the median install-to-paid conversion rate within 35 days is 2.0%.
- Out of every 100 downloads, two people pay.
- By Category:
- Health & Fitness: 2.9% median (6.2% top quartile)
- Business: 2.6% median (5.0% top quartile)
- Shopping: 1.3% median
- Gaming: 1.0% median (2.3% top quartile)
If your app operates under a standard freemium or soft-paywall model, 2.0% is your baseline target. But that brings us to the biggest lever in the entire dataset.
The 4 Biggest Strategic Levers
1. Hard Paywall vs. Freemium: The 5x Gap
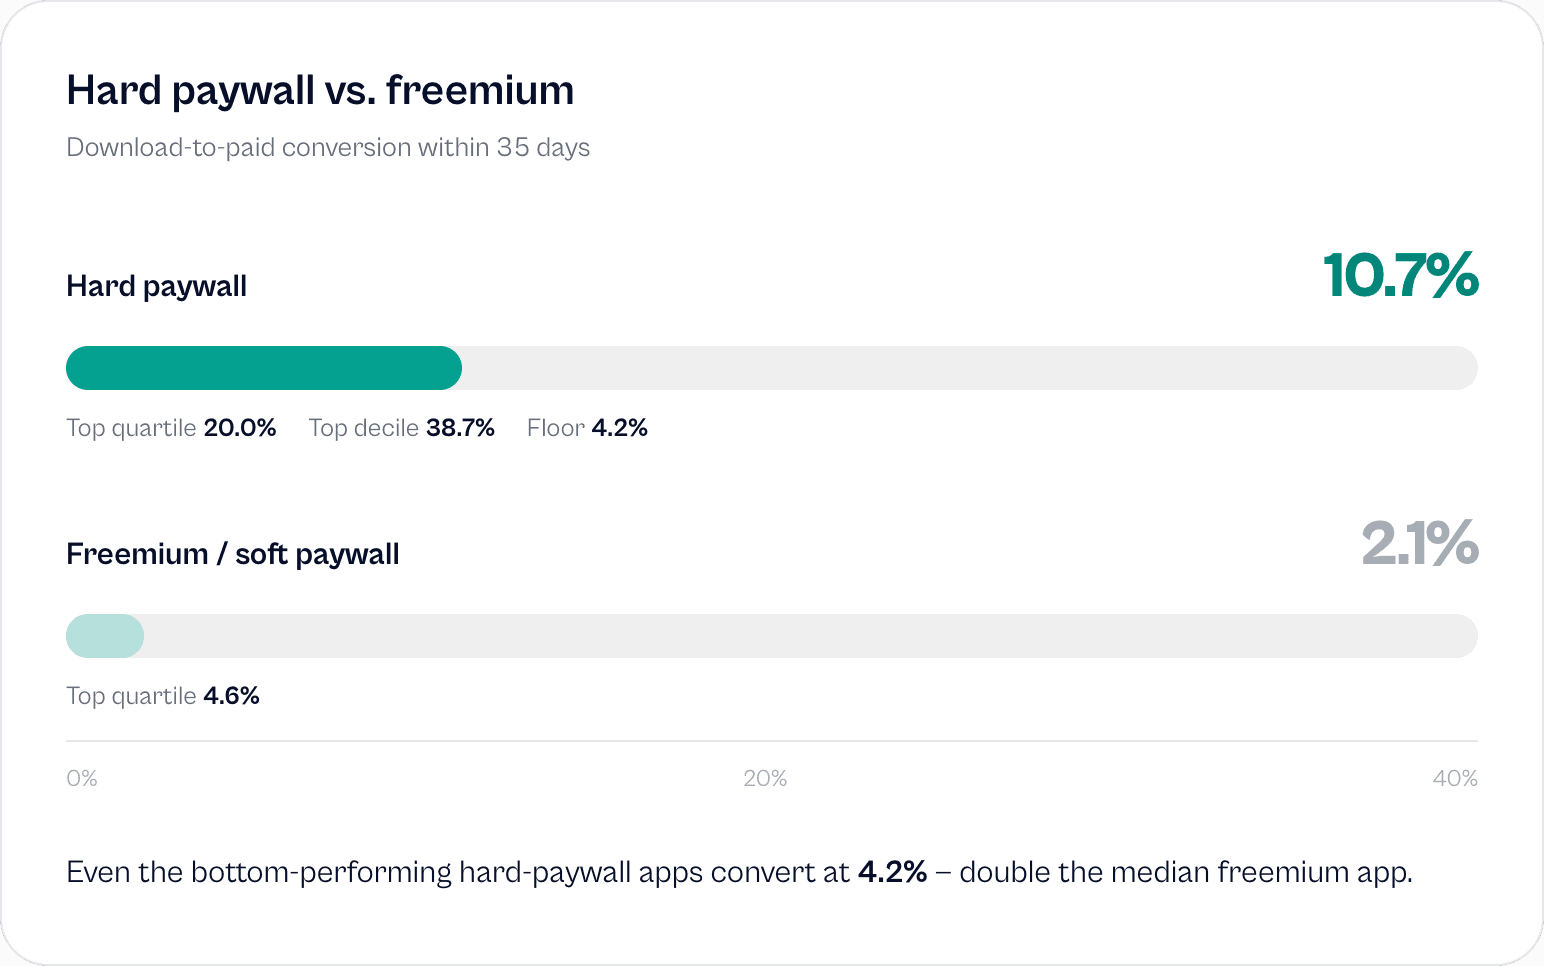
Freemium is not inherently wrong, but it is an expensive customer acquisition strategy paid for with lost conversions. Unless your product relies on aggressive viral loops or multi-sided network effects (social apps, marketplaces, collaborative tools), you should almost certainly launch with a hard paywall.
A hard paywall pulls cash flow forward, keeps your support overhead lean, and filters out tire-kickers who demand 24/7 support without ever pulling out a credit card.
2. Day 0 Is Your Whole Business
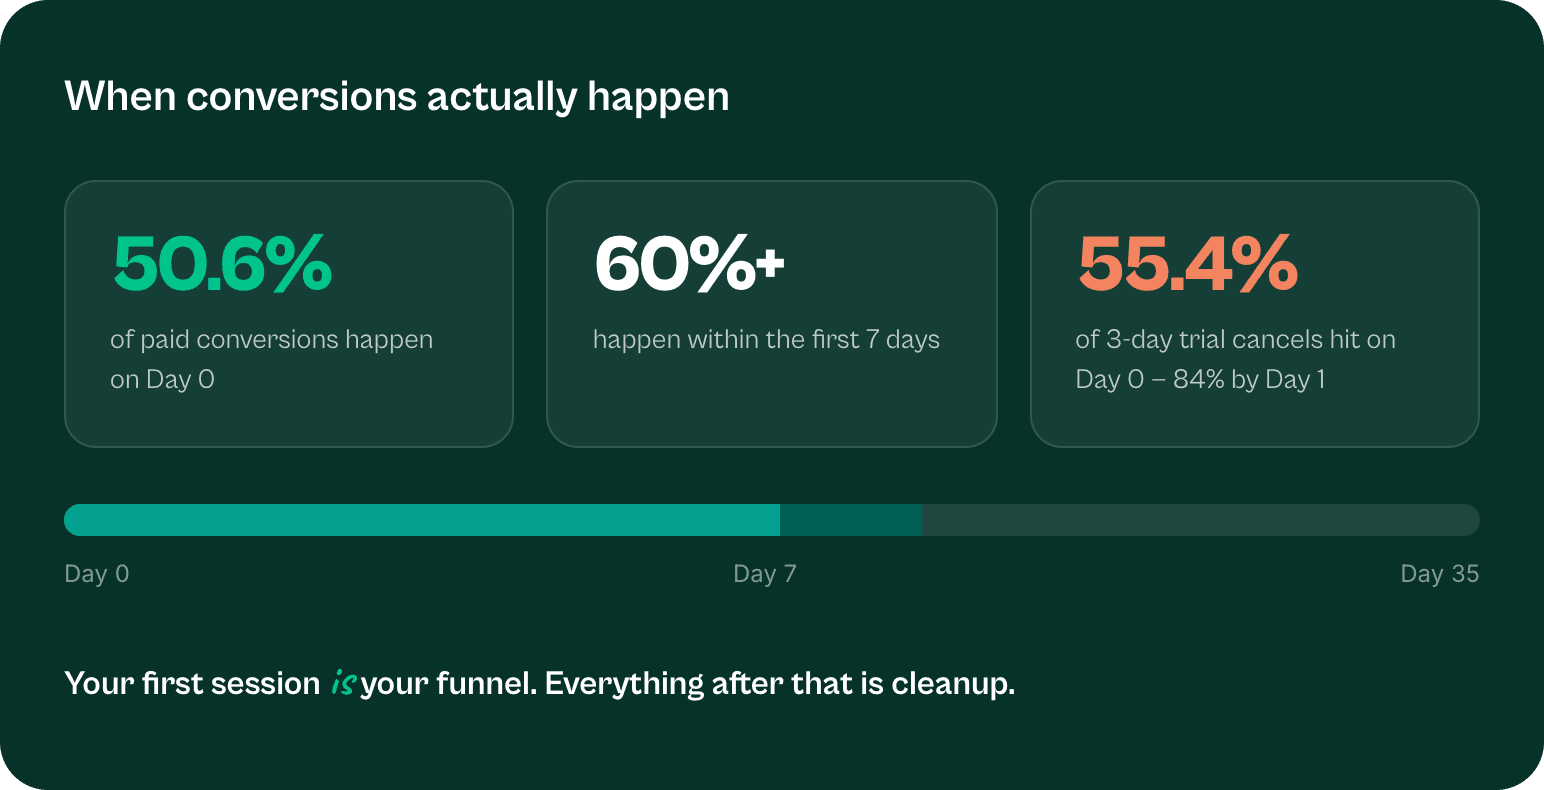
Your user’s intent will never be higher than the moment they tap “Download.” They downloaded your app because they have an active pain point right now. Your first session IS your funnel. Everything after that is cleanup. If your monetization strategy relies on sending a push notification on Day 14 to prompt an upgrade, you’ve already lost the battle.
3. Price Anchoring & The Trap of Underpricing
Looking at real-world consumer subscription pricing:
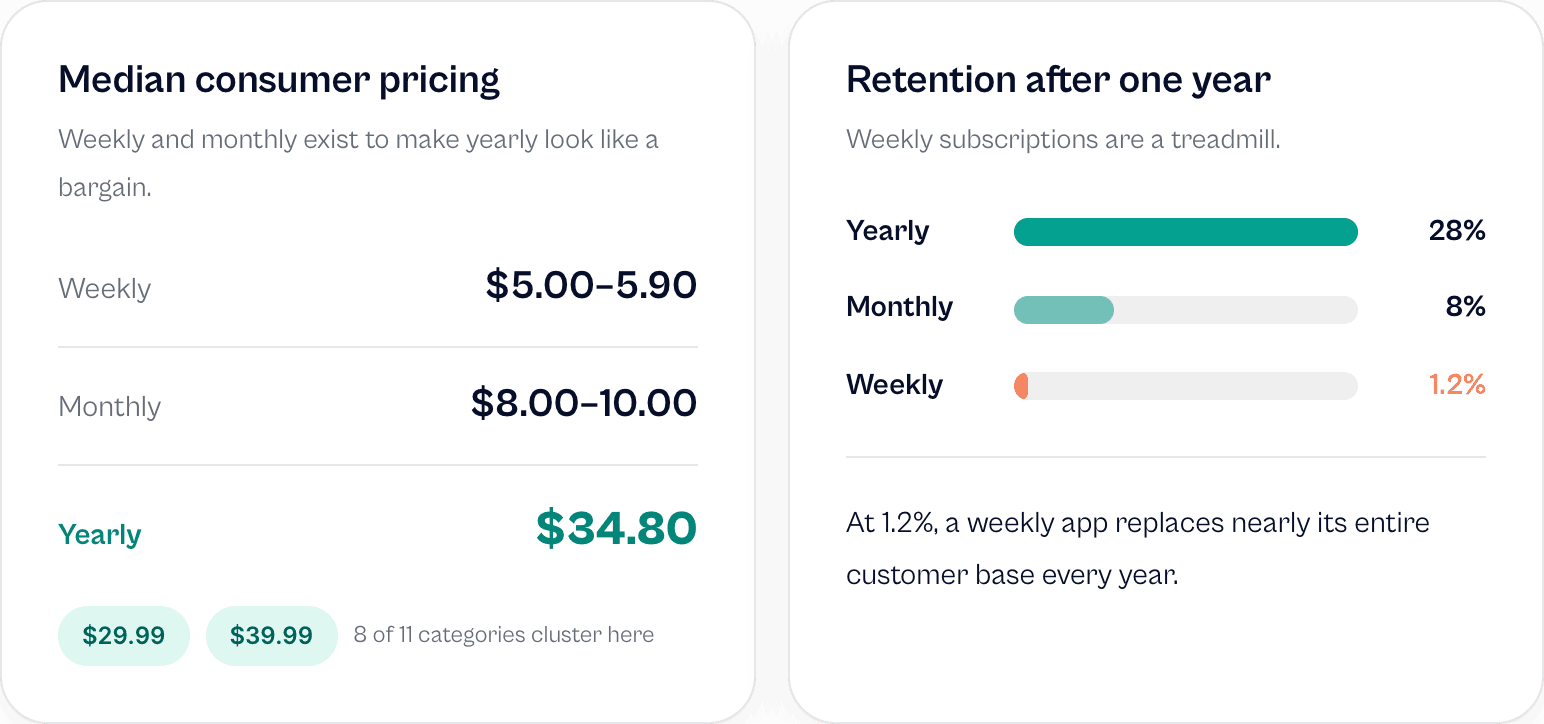
In 8 out of 11 app categories, yearly pricing concentrates tightly at $29.99 or $39.99. If your annual plan is priced at an odd tier like $14.99, you are abandoning basic anchor psychology.
Notice the ratio: a user can buy a full year for $35, or pay 5–8 every week or two. The weekly and monthly tiers exist primarily to make the yearly subscription look like an irresistible bargain.
Furthermore, weekly subscriptions are a retention treadmill:
- Yearly retention after 1 year: 28%
- Monthly retention after 1 year: 8%
- Weekly retention after 1 year: 1.2%
At 1.2% annual retention, a weekly-subscription app must replace nearly 100% of its customer base every single year. Push users toward annual plans during onboarding. If you do offer trials, offer them only on annual plans, not on monthly subscriptions.
4. Involuntary Churn: The Silent Revenue Leak
Not all churn occurs because users fell out of love with your app:
- 15.2% of App Store cancellations are due to billing failures.
- 32.2% of Google Play cancellations—nearly one in three—are billing failures.
These are users who never intended to cancel; their card expired, was replaced,or temporarily declined.
Winning back an existing user through billing retry logic, automated grace periods (typically 16–23 days out), and clear in-app payment update prompts is vastly cheaper than acquiring a new user through paid ads.
User Acquisition Reality Check: What Is an Install Actually Worth?
If you are running paid user acquisition (Apple Search Ads, Meta, TikTok), you need to know your real revenue ceiling:
- All Apps Day-14 Revenue per Install: $0.23
- All Apps Day-60 Revenue per Install: $0.34
- Hard Paywall Day-60 Revenue per Install: $3.09 (Top quartile: $5.50)
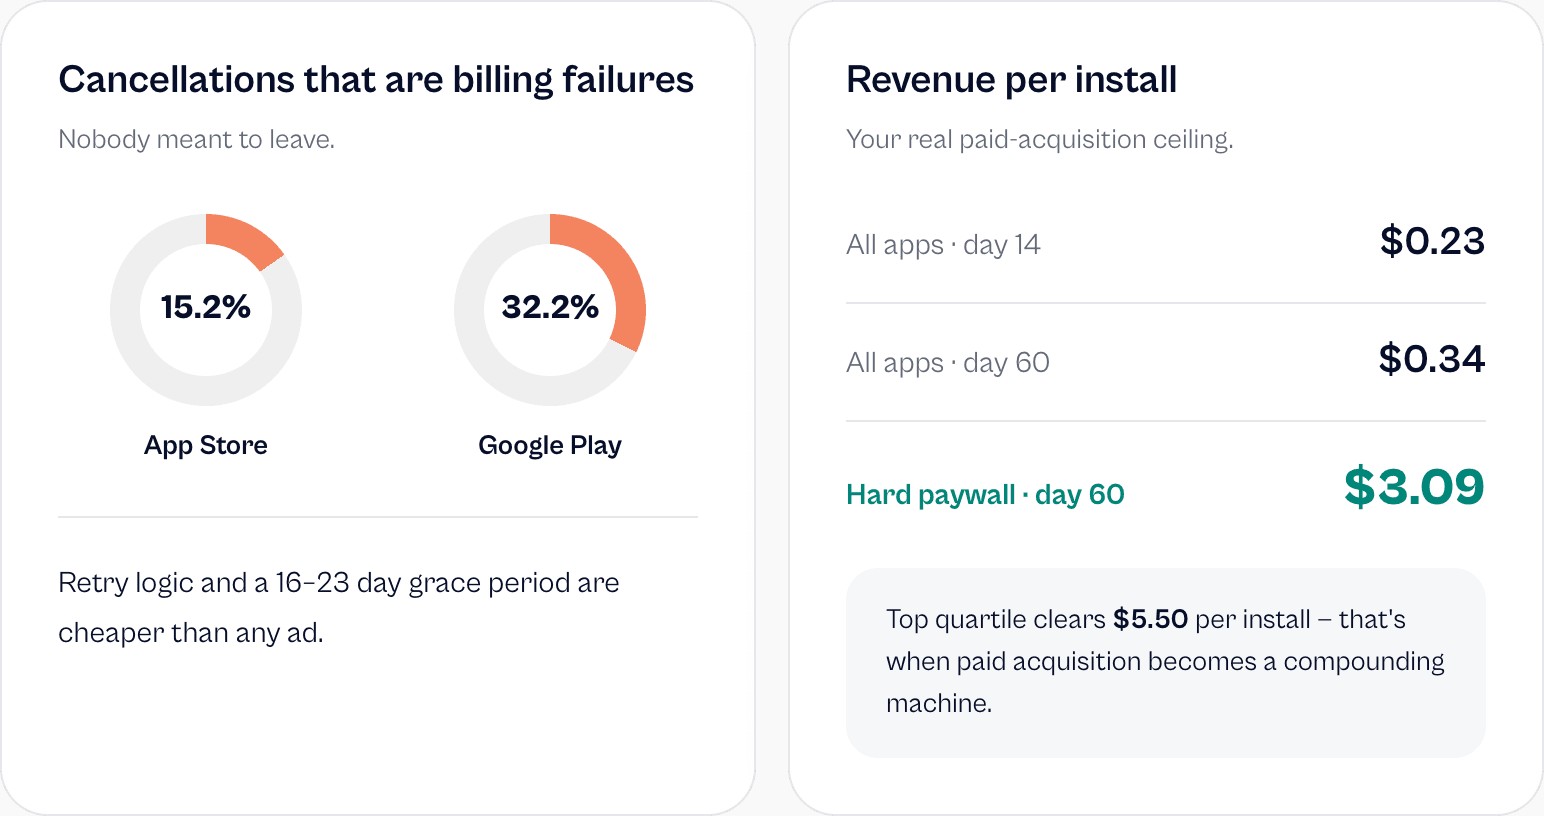
If your app generates an average of $0.34 within 60 days of install, you cannot spend $2.00 per download on ads and call it a growth strategy. Conversely, if you run an optimized hard paywall generating $3.00 to $5.00+ per install, paid acquisition suddenly becomes a viable compounding machine.
Action Plan: Audit Your App in 3 Steps
Instead of rewriting your codebase or designing your fifth new feature this month, open a spreadsheet and run this diagnostic:
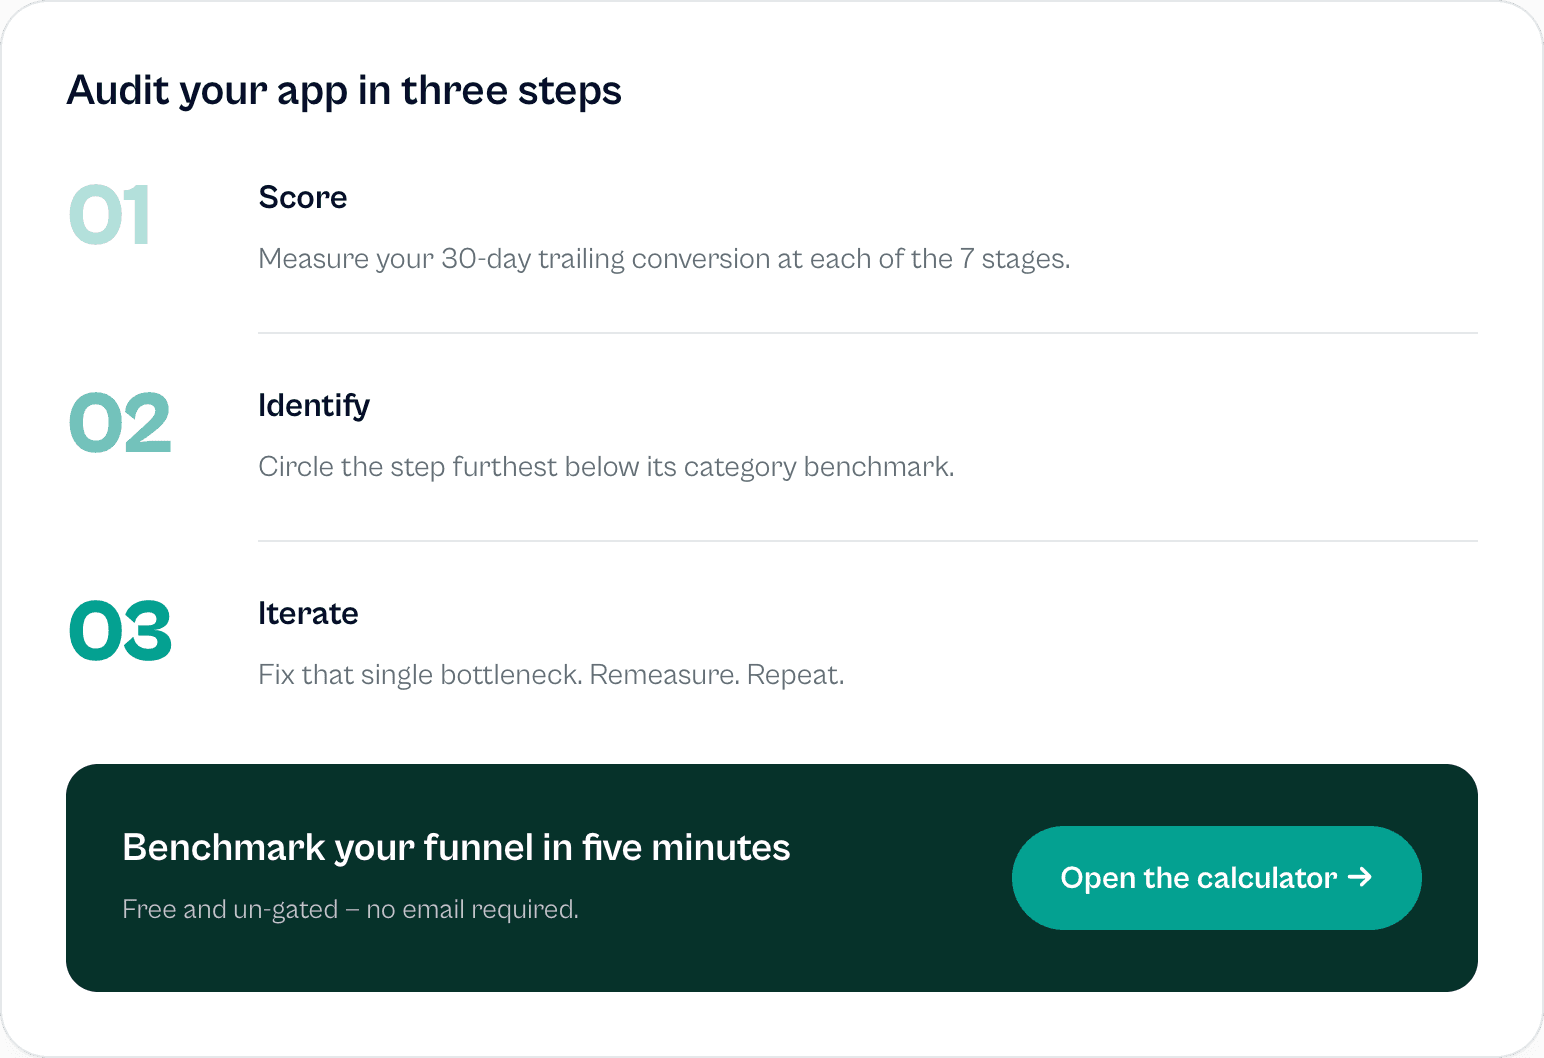
- Score Your Funnel at Every Step: Measure your 30-day trailing numbers for Impressions, Download Rate, Onboarding Completion, Paywall Views, Trial Starts, Trial-to-Paid Conversion, and Composite Install-to-Paid.
- Circle Your Single Biggest Drop-Off: Compare your figures against your category’s median and top-quartile benchmarks. Find the step where the gap between your metric and the benchmark is largest.
- Fix It, Remeasure, and Repeat: Moving one step in your funnel by a single percentage point lifts every single metric downstream.
To benchmark your numbers against the full dataset in under five minutes, you can use the free, ungated Flywheel Subscription Benchmark Calculator.
Stop guessing what to build next. Treat your app like a science, optimize the funnel first, and let the compounding begin.